Projects
Workers’ Compensation Underwriting ML Quote App
May
2025
Ongoing
Problem / Purpose
The existing quote model used for workers’ compensation underwriting was ineffective at predicting risk—especially for new clients or clients with volatile claim histories—resulting in limited utility for pricing strategy.
Solution
Redesigned the model from scratch. Created a new dataset combining historical workers’ comp premiums, wages, class codes, and claims data. Developed claim development factors from 10+ years of historical captive data and applied NCCI’s split point methodology to generate a target using primary and ratable excess losses. Built and refined a frequency-severity LightGBM model in DataRobot. Integrated the model into a custom app for the Pricing Team to quote new clients based on estimated annual claims.

Key Achievements / Impact
Delivered a highly improved model that accurately predicts claims for both established and new businesses. Enabled the Pricing Team to stratify risk and assign more accurate underwriting rates. Model performs well for expected claims under $100K and clearly flags high-risk clients over that threshold. App still in active use.
Key Technologies / Tools Used
DataRobot, SQL, Excel, DBT, Insurance Underwriting, Workers' Compensation, Workers' Compensation Underwriting, Feature Engineering, Data Modeling, Snowflake, ML Models, ML Models (Frequency-Severity)
Role
Data Scientist
ProService Hawaii
Voice Call Self-Service Reporting via Google Sheets
Mar
2025
Ongoing
Problem / Purpose
SSRS and Tableau reporting created a bottleneck, as most employees lacked the access or skills to work directly with Snowflake data. One manager responsible for phone queue oversight had to manually download call data from the phone system and analyze it in Excel—a process that took several hours each time and delayed timely insights.
Solution
Created a self-service voice call reporting tool using Coefficient and Google Sheets. Built cleaned and aggregated Snowflake layers from raw Amazon Connect call data using DBT and Dagster. Scheduled data syncs to Google Sheets and built a tabular + dashboard view to replace manual reporting. Logged process insights and limitations for future self-service data product development.


Key Achievements / Impact
Replaced multi-hour manual Excel-based call reporting with a scheduled, self-updating dashboard accessible to business users. Proved the viability of Coefficient-based reporting, paving the way for wider adoption of self-service data tools.
Key Technologies / Tools Used
Snowflake, DBT, Dagster, Coefficient, Salesforce, Amazon Connect, Data Product Design, Google Sheets
Role
Data Scientist (self-initiated)
ProService Hawaii
Automated Sales Performance & True-Up Reporting
Feb
2025
Ongoing
Problem / Purpose
Sales Team manually created a complex report to track quotas, closed-won deals, true-ups, and non-materialized sales. The process was very labor-intensive.
Solution
Developed a data source in Snowflake using SQL in DBT and Dagster to pull quota, closed-won, and invoice data from Salesforce. Created logic to accurately capture first-invoice annualization for clients with varied pay groups (e.g., weekly, semi-monthly). Leveraged Coefficient to import this data into a dynamic Google Sheet with role-based views (BDM, management). Included an override sheet for manual adjustments where needed.


Key Achievements / Impact
Reduced manual reporting workload by automating data retrieval and calculations. Provided a scalable, multi-year reporting structure with detailed true-ups and flexible first-invoice annualization.
Key Technologies / Tools Used
SQL, Snowflake, DBT, Dagster, Salesforce, Coefficient, Google Sheets, Google Sheets (Advanced Formulas)
Role
Data Scientist (company project)
ProService Hawaii
Client Contact Clustering & Segmentation
Feb
2025
Ongoing
Problem / Purpose
Client-facing contacts varied widely in behavior, influence, and satisfaction, but there was no structured way to segment or understand them. This limited the company’s ability to target referrals, gather testimonials, or identify service issues.
Solution
Self-initiated an end-to-end contact clustering project. Built an aggregated dataset from raw Salesforce data including job role, tenure, communication volume and quality, case metrics (e.g., reopen rate, time to close), sentiment analysis, and NPS history. Ran clustering models in DataRobot and identified 6 distinct contact groups, with strong alignment to NPS segments and referral behavior. Delivered interpretability insights and guidance for future data collection (e.g., contact influence and goals).

Key Achievements / Impact
Enabled Account Managers to prioritize promoter-type contacts for referrals/testimonials and recognize patterns in dissatisfied contact types. Provided foundational logic for future segmentation and service strategy improvements.
Key Technologies / Tools Used
DBT, Dagster, DataRobot, Salesforce, Snowflake, SQL, ML Models (Clustering), ML Models, Data Product Design, Sentiment Analysis, NPS Analytics
Role
Data Scientist (self-initiated)
ProService Hawaii
Client Survival Analysis & Break-Even Modeling
Feb
2025
Ongoing
Problem / Purpose
The company lacked visibility into when and why clients terminate, how long they remain profitable, and how break-even timing differs across client types. This limited the ability to strategically allocate resources and optimize service models.
Solution
Self-initiated a survival analysis project to model client term timelines and break-even points using Kaplan-Meier survival curves. Segmented analysis by service offering, client size, and termination reason (e.g., out of business vs. switching providers). Modeled breakeven for administrative fees versus sales acquisition and servicing costs. Ran Python survival models from a self-service Snowflake data object using dbt and Dagster. Outputs informed retention strategies and product focus.


Key Achievements / Impact
Revealed client lifecycle patterns and profitability dynamics across key segments. Enabled leadership to better prioritize client types for retention, product tailoring, and resource allocation.
Key Technologies / Tools Used
Python, Survival Analysis, Data Analysis, DBT, Dagster, Python (Pandas), Snowflake, Data Modeling, Segmentation Analysis, Python (lifelines)
Role
Data Scientist (self-initiated)
ProService Hawaii
Payroll Case Relevance Prioritization Prototype
Dec
2024
Problem / Purpose
The Payroll Operations Team was missing critical information buried in Salesforce cases due to lack of labeling, causing a high error rate in payroll processing. Teams were overwhelmed and unable to manually flag relevant cases.
Solution
Proposed a multi-phase project to automate case review using Snowflake Cortex’s SUMMARY function and keyword flagging. Built a prototype report that scored and sorted cases by potential relevance based on flagged terms in email content, subjects, and descriptions. Report included summaries, filters by pay date, and deep links to case details. Future phases included iterative refinement of keywords and training an ML model on labeled case data.


Key Achievements / Impact
Delivered a working prototype to prioritize high-risk payroll cases with automated summaries and scoring logic. Though full implementation was paused due to shifting company priorities, the solution was positively received and seen as highly impactful by the Operations Team.
Key Technologies / Tools Used
Snowflake, SQL, Snowflake (Cortex Generative AI Tools), Salesforce, Data Product Design, DBT, Dagster, End-to-End Data Pipeline Design, Microsoft SQL Server (MSSQL), Process Improvement, Text Mining
Role
Data Scientist (company project)
ProService Hawaii
Self-Service Data Object Suite
Dec
2024
Ongoing
Problem / Purpose
Reliance on SSRS and Tableau created a bottleneck for report creation, since only the Analytics Team had Snowflake access or technical skills. As a result, many valid data needs from other teams went unmet or were manually handled in Excel/Google Sheets.
Solution
Designed and built multiple self-service data objects covering anticipated and requested data needs for cases, calls, sales, clients, and contact details. Sourced from iSolved HRIS, PrismHR (multiple instances), Salesforce, and claim systems. Defined the database schemas, table structures, and layered data models to support scalable, efficient querying. Created cleaned, typed layers and master/reference tables using DBT and Dagster. Final objects were used for both object-based and snapshot reporting, and loaded into Google Sheets via Coefficient for self-service access.

Key Achievements / Impact
Delivered robust, scalable data architecture and self-service products that preemptively addressed cross-functional reporting needs. Greatly reduced reliance on Analytics Team and improved access to trusted data sources. Strong user adoption and positive feedback across departments.
Key Technologies / Tools Used
DBT, Dagster, SQL, Snowflake, Amazon Connect, HRIS, Salesforce, Data Product Design, Data Modeling, Schema Design, Data Architecture
Role
Data Scientist (company project)
ProService Hawaii
Sales Opportunity Predictive Forecasting
Sep
2024
Ongoing
Problem / Purpose
The Sales Team relied on qualitative labeling and Salesforce Einstein scores to predict opportunity closures, both of which were not sufficiently accurate.
Solution
Used DBT and Dagster to build a Snowflake data pipeline sourced from Salesforce. Created two models in DataRobot using a Random Forest Classifier—one for the first half of the sales process and one for the second half. Ensured proper data partitioning to avoid leakage. Scheduled the model training and scoring to run weekly, storing results in Snowflake (with snapshot history) and loading predictions into Salesforce.

Key Achievements / Impact
Reduced reliance on inaccurate manual or Einstein-based forecasts. Achieved 90–95% accuracy in predicting whether an opportunity would close in the current or following month, significantly improving forecasting reliability for both Sales and executive leadership.
Key Technologies / Tools Used
SQL, Snowflake, DBT, Dagster, DataRobot, Salesforce, ML Models (Classifier), End-to-End Data Pipeline Design, Model Scoring Automation
Role
Data Scientist
ProService Hawaii
Automated HRIS Document Extraction & Decoding
Aug
2024
Problem / Purpose
During HRIS migration, there was no method to bulk download stored documents (PDFs and images) from the legacy system. Manual extraction was unscalable, and encoded data posed challenges for decoding and storage.
Solution
Developed an automated solution to extract encoded employee and client documents via the HRIS API, storing metadata and file references in Snowflake. Built a Python-based decoding pipeline to handle large, encoded data chunks, manage invalid file types, and output files into a structured shared drive using standardized naming and folder conventions. This enabled clean handoff to the new HRIS and allowed document access for clients when needed.


Key Achievements / Impact
Eliminated the need for manual document extraction across thousands of client records. Delivered a scalable, organized archive of HRIS documents that could be imported into the new system and referenced reliably. Improved traceability and operational efficiency during the HRIS migration.
Key Technologies / Tools Used
Python, API, Snowflake, File Decoding, Process Automation, Document Management, HRIS
Role
Data Scientist
ProService Hawaii
Data Job Trends Analysis from LinkedIn Postings
Jul
2024
Problem / Purpose
Job seekers and hiring managers often lack clear, up-to-date insight into demand trends and skill requirements across data roles. Publicly available reports are often too high-level or outdated.
Solution
Scraped 6,510 LinkedIn job postings using Python to analyze trends across data job titles. Explored demand by role type, employer industry and size, job location and work mode, seniority, employment type, pay ranges, and most sought-after skills by role. Created visuals and published a two-part Medium article highlighting actionable findings and insights for aspiring data professionals.


Key Achievements / Impact
Delivered two-part public analysis with data-backed insights into the data job market. Demonstrated the ability to independently gather, clean, analyze, and communicate complex information clearly. Article supports career planning and job market navigation.
Key Technologies / Tools Used
Python, Python (BeautifulSoup), Python (Selenium), Web Scraping, Data Analysis, Python (Pandas), Data Visualization
Role
Data Scientist
Personal Project
Experimental Case Clustering via Email Text
Jul
2024
Problem / Purpose
The goal was to group Salesforce cases based on underlying subject matter for better trend detection and categorization. Manual tagging wasn’t scalable, and leadership wanted a way to automate pattern discovery.
Solution
Used cleaned email text from Salesforce cases and applied K-means clustering in Python. Focused initially on verb-based features, but resulting clusters reflected actions rather than topic content. Determined that further development was needed to improve semantic relevance, but project was paused due to shift in company priorities.
Key Achievements / Impact
Explored the use of unsupervised learning for automated case categorization. Though not implemented, the work highlighted feature design limitations and informed future approaches to NLP-driven case analysis.
Key Technologies / Tools Used
Python, ML Models (Clustering)
Role
Data Scientist
ProService Hawaii
Automated Data Extraction for HRIS Migration
Jan
2024
Problem / Purpose
As part of migrating clients between Human Resource Information Systems (HRIS), the legacy platform (iSolved) lacked sufficient export functionality for client and employee data. Gaps in available OData and API endpoints made manual extraction time-consuming and impractical at scale.
Solution
Built custom Python automation with web scraping using Selenium and HTML parsing to log into iSolved, navigate client profiles, and extract key data unavailable via API. Supplemented scraping with automated report downloads from the Report Center, ingesting CSVs and loading into Snowflake. Enabled clean downstream use for data migration into the new HRIS.
Key Achievements / Impact
Automated extraction of complex, inaccessible data across thousands of clients. Saved the migration team from hours of manual work and enabled a smooth transition between HRIS platforms despite technical limitations.
Key Technologies / Tools Used
Python, Web Scraping, Python (Selenium), Python (Pandas), HTML, Process Automation, Snowflake, HRIS, Python (BeautifulSoup)
Role
Data Scientist (self-initiated)
ProService Hawaii
Email Text Cleaner for Communication Mining
Jun
2023
Problem / Purpose
Emails stored in Salesforce were difficult to analyze due to reply chains, signatures, legal disclaimers, and other noise that obscured meaningful communication patterns.
Solution
Built a SQL-based text parser in Snowflake to process email content row-by-row. Identified and removed repeated signature blocks, reply history patterns, and automated disclaimers to create a cleaned dataset of email content suitable for text analysis and downstream modeling.
Key Achievements / Impact
Created a reusable cleaned email dataset that became the foundation for multiple downstream analytics and ML projects, significantly improving signal clarity for communication-based insights.
Key Technologies / Tools Used
Snowflake, SQL, Text Cleaning, Email Parsing, Process Design, Process Automation
Role
Data Scientist (self-initiated)
ProService Hawaii
Error Communication Flagging & Reporting
Jun
2023
Problem / Purpose
Leadership needed a way to identify client or internal emails referencing possible service errors (e.g., payroll issues), but scanning raw email threads was inefficient and unreliable.
Solution
Used the cleaned email dataset to identify common error-related phrases. Created a dedicated table tagging emails based on matching keywords, and built a Tableau report that allowed users to dynamically include/exclude flagged phrases. Enabled fast scanning and review of potential service issue communications.

Key Achievements / Impact
Delivered a dynamic reporting solution that enabled stakeholders to efficiently monitor communications for possible service breakdowns. Provided a flexible interface to refine keyword sets and reduce manual email review time.
Key Technologies / Tools Used
Snowflake, SQL, Tableau, Text Analysis, Text Mining, Data Product Design
Role
Data Scientist
ProService Hawaii
Business Minutes Between Timestamps Calculation
Mar
2023
Problem / Purpose
Multiple reports required accurate calculations of business hours between two timestamps, but no consistent or scalable method existed across teams.
Solution
Developed a join-based approach to calculate business minutes by creating a minute-level reference table with associated lookup values. The solution joins to start and end timestamps, then calculates the difference between lookup values to derive business time. Adopted as the standard method and used for 4+ years.
Key Achievements / Impact
Created a durable and widely adopted solution for calculating business time across reports. Eliminated inconsistency and manual workarounds, becoming the go-to method for timestamp-based metrics across teams.
Key Technologies / Tools Used
SQL, Snowflake, Time Dimension Modeling, Reporting Infrastructure
Role
Data Scientist
ProService Hawaii
Client Satisfaction Prediction Model
Jan
2023
Ongoing
Problem / Purpose
The company needed a way to proactively identify clients at risk of dissatisfaction or termination, and to highlight those likely to provide referrals. Existing feedback (e.g., NPS) came too late for proactive action.
Solution
Built an end-to-end ML pipeline using Salesforce data to predict client satisfaction as Delighted, Satisfied, or Poor. Engineered ~300 features capturing client profile (size, industry, tenure), communication patterns (volume, direct vs. employee, sentiment via Snowflake Cortex, time to resolve), risk indicators (AR balance, layoffs, internal handoffs), product usage, referral history, and summarized NPS trends. Trained a LightGBM model in DataRobot, prioritized top 16 features, handled class imbalance, and automated scoring/prediction flow (Snowflake ↔ DataRobot ↔ Salesforce). Developed feedback loop for future feature enhancement.
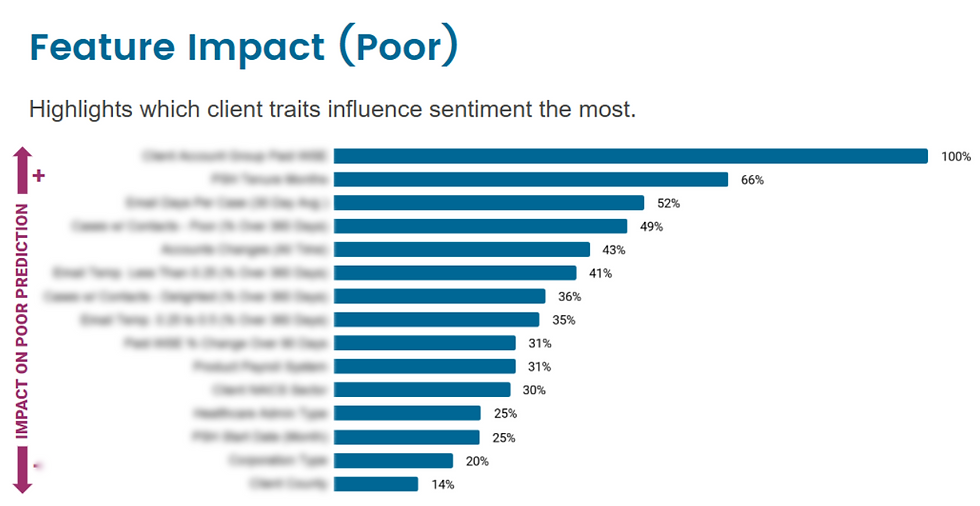

Key Achievements / Impact
Enabled weekly satisfaction prediction to proactively engage at-risk clients and strengthen referral outreach. Improved visibility into client health, supported client success workflows, and provided a foundation for ongoing model refinement.
Key Technologies / Tools Used
DataRobot, Snowflake, Salesforce, ML Models (Classifier), Feature Engineering, Class Imbalance Handling, End-to-End Data Pipeline Design, SQL
Role
Data Scientist
ProService Hawaii
Responsiveness KPI Dashboard (Calls & Cases)
Mar
2022
Problem / Purpose
Leadership needed centralized visibility into responsiveness across client-facing channels, including phone and case activity. Metrics existed in separate systems and lacked consistency or trend reporting.
Solution
Built a company-wide KPI dashboard using raw Salesforce and Amazon Connect data in Snowflake. Created metrics for call responsiveness (answer rate, answer time, voicemails) and case handling (resolution time, reopen rate, case flow). Final dashboard built in Tableau with summary and trend tabs, definitions, and filters. Maintained usage for 1–2 years.
Key Achievements / Impact
Delivered a unified dashboard used across the organization for tracking responsiveness KPIs. Enabled visibility into both near-real-time metrics and historical trends. Supported operational monitoring and performance review across departments.
Key Technologies / Tools Used
Snowflake, Amazon Connect, Salesforce, Tableau, Data Modeling, KPI, Dashboard Design, SQL
Role
Data Scientist
ProService Hawaii
Pricing & Sales Proposal Export Automation
Dec
2020
Ongoing
Problem / Purpose
The existing pricing and sales proposal exports were outdated, complex, and required extensive manual edits. Sales Operations had to manually replicate Pricing's changes, leading to errors and inefficiencies. Switching between sales models required redoing work, and glitches and formula nuances caused frequent mistakes.
Solution
Rebuilt the spreadsheet from scratch, fixing calculation errors and consolidating all pricing and sales model exports into a single file. Added override fields for controlled edits, ensuring clarity and reducing the need for manual formula adjustments. Enabled seamless transitions between sales models with minimal rework.


Key Achievements / Impact
Eliminated manual edits across departments, reducing errors and saving Sales Operations hours per deal. Enabled seamless switching between sales models without rework. Improved usability for non-technical users.
Key Technologies / Tools Used
Excel (Advanced Formulas), Excel (Automation), Excel, Salesforce, Conga, Data Analysis, Strategic Document Design, Process Improvement
Role
Manager, Insurance and Profitability (self-initiated)
ProService Hawaii
Client Health Claims Benchmarking Report
Aug
2020
Problem / Purpose
Larger clients wanted insights on employee wellness trends and healthcare usage to support initiatives like flu shots and chronic condition management. The company lacked a scalable, data-driven product to provide value in this space.
Solution
Independently initiated and built a reporting solution based on the Health Care Cost Institute’s (HCCI) public methodology. Used raw claims data to replicate HCCI metrics and benchmark client-level performance against national data. Created custom reports for large clients showing chronic condition prevalence, utilization rates, prescription share, claim spend, and more. Designed the reports to support future integration with nurse or physician advisory services for tailored wellness recommendations.


Key Achievements / Impact
Produced an innovative, HIPAA-compliant client reporting concept aimed at increasing client satisfaction and creating a unique product offering. Although the product didn’t launch due to a role transition, the framework remains a potential foundation for future white-glove client programs.
Key Technologies / Tools Used
SQL, Excel, Word, Data Analysis, Healthcare Analytics, HIPAA Compliance, Claims Data Analysis, Health Insurance, Insurance Analytics
Role
Manager, Insurance and Profitability (self-initiated)
ProService Hawaii
Insurance & Risk Training and Reference Hub
Aug
2020
Ongoing
Problem / Purpose
New employees had no centralized resource for understanding the complex insurance landscape, risk management practices, and unique product structures at the company. This created challenges in training, knowledge transfer, and consistency across Pricing and Risk teams.
Solution
Developed an internal website to serve as a comprehensive training and reference tool. It included guides on insurance lines (workers’ comp, health, TDI), forecasting methods, PEO vs. HR-only products, Hawaii’s economic landscape, and internal processes for pricing and insurance renewals. Originally created to train a direct report, it became a key asset still used by Pricing, Risk, and new leadership.


Key Achievements / Impact
Accelerated onboarding and training for new team members and leadership. Improved consistency and understanding of complex insurance operations. Resource is still in active use across multiple departments.
Key Technologies / Tools Used
Google Sites, Operational Knowledge Management, Process Improvement, Visual Documentation, Training Material Development, Health Insurance, Workers' Compensation
Role
Manager, Insurance and Profitability (self-initiated)
ProService Hawaii
Repricing Report for At-Risk Clients
Jul
2020
Problem / Purpose
The repricing process for at-risk clients relied on manual data gathering across multiple departments, delaying turnaround and reducing the company’s ability to respond quickly to retention risks.
Solution
Developed an SSRS report that allowed users to input a client ID and instantly retrieve historical and current rates across all lines of business, along with high-level client context. Designed to be used alongside the client profitability report to support quick, informed repricing decisions.


Key Achievements / Impact
Reduced repricing turnaround time from 2–4 days to 1��–2 days. Improved internal efficiency and responsiveness for client retention efforts. Report became a key tool for the Pricing Team.
Key Technologies / Tools Used
SQL Server Reporting Services (SSRS), SQL, Cross-Line Rate Analysis, Report Automation, Retention Strategy
Role
Manager, Insurance and Profitability (self-initiated)
ProService Hawaii
COVID-Era Monthly Profitability Forecasting
May
2020
Problem / Purpose
During the onset of COVID-19, leadership needed to understand how client shrinkage and rate relief would impact month-by-month profitability. Uncertainty in economic conditions made traditional forecasting unreliable.
Solution
Built a model using public state unemployment rates and internal profitability data to estimate client shrinkage and margin erosion. Incorporated configurable inputs for temporary rate relief programs. Forecasted changes to overall profitability month by month. Final results were within 5% of actual performance.
Key Achievements / Impact
Enabled leadership to plan for pandemic-related financial disruption with confidence. Provided flexible modeling that allowed for scenario adjustments. Forecast remained highly accurate despite market volatility.
Key Technologies / Tools Used
Excel, Public Data Integration, Scenario Forecasting, Margin Modeling, COVID Impact Modeling
Role
Manager, Insurance and Profitability
ProService Hawaii
Client Profitability Report
Mar
2020
Problem / Purpose
The Pricing Team had no way to holistically assess a client’s profitability when Account Managers escalated repricing requests. Without visibility into billing, claims, or insurance-related costs, repricing decisions lacked data-driven support.
Solution
Independently created a reporting solution using Microsoft SQL Server and SSRS that integrated billing data from HRP-Prism HRIS with state unemployment insurance (SUTA), workers’ comp (WC) claim data, and overhead costs for insurance and benefits. The report displayed client tenure, industry, service offering, plan details, revenue stream profitability, WC claims history, and worksite employee trends—accompanied by summary graphs for visual context.


Key Achievements / Impact
Data-enabled the Pricing Team to assess clients holistically and make informed, targeted repricing decisions. Introduced benchmarking and per-stream profitability analysis, improving precision and defensibility of pricing strategies.
Key Technologies / Tools Used
Microsoft SQL Server (MSSQL), SQL Server Reporting Services (SSRS), HRP-Prism HR Software, HRIS, SQL
Role
Manager, Insurance and Profitability (self-initiated)
ProService Hawaii
Claims Forecasting via Development Factors for Captive WC Plan
Mar
2019
Problem / Purpose
Leadership needed a reliable method to forecast claims month-over-month for the company’s captive workers’ compensation plan.
Solution
Developed custom development factors based on historical claim emergence patterns. Used year-over-year claims data to forecast future claim development at a monthly cadence.
Key Achievements / Impact
Enabled proactive claims reserve planning and financial forecasting for the captive WC program. Provided actuarial-aligned estimates tailored to the company’s internal needs.
Key Technologies / Tools Used
Excel, Claims Data Analysis, Forecasting Models, Workers' Compensation, Workers' Compensation Analytics
Role
Manager, Insurance and Profitability
ProService Hawaii
Workers’ Compensation Net Rate Calculation Model
Oct
2018
Problem / Purpose
Rate modifications were complex and applied inconsistently across teams. Underwriters and HR configuration staff needed a structured tool to apply margins and adjustments to gross rates.
Solution
Built a flexible Excel-based model to apply rate modifiers and calculate net workers’ compensation rates. Included margin fields and was used by both underwriters and the internal HR configuration team to standardize rate inputs across processes.
Key Achievements / Impact
Improved consistency in rate application and reduced manual errors in client configuration. Tool was adopted by underwriting and implementation teams.
Key Technologies / Tools Used
Excel, Rate Modeling, Process Design, Insurance Pricing, Workers' Compensation Underwriting, Workers' Compensation
Role
Manager, Insurance and Profitability
ProService Hawaii
Mergers & Acquisitions Due Diligence – Competitor Acquisition
Jun
2018
Problem / Purpose
ProService Hawaii was acquiring a major competitor and needed rigorous due diligence to evaluate profitability, validate financial data, and assess risk exposure across billing, insurance, and tax.
Solution
Selected to join a cross-functional team responsible for acquisition due diligence. Forecasted expected profitability from the acquisition using revenue and cost data. Reviewed and validated detailed billing, insurance, and tax records to assess risk and confirm valuation. Collaborated with Finance, Legal, and Executive leadership.
Key Achievements / Impact
Played a key role in a successful acquisition by providing trusted financial projections and surfacing potential risk areas. Helped leadership make informed decisions during a high-impact transaction.
Key Technologies / Tools Used
Excel, SQL, Financial Forecasting, Risk Analysis, Billing & Tax Data Review, M&A Due Diligence
Role
Manager, Insurance and Profitability
ProService Hawaii
Revenue Forecast Variance Root Cause Analysis
Mar
2018
Problem / Purpose
The company experienced a large Q1 revenue shortfall despite having a record sales year the prior year. Leadership needed to understand the disconnect between forecasted and actual revenue.
Solution
Performed an ad hoc revenue breakdown by source and client segment. Identified that a recent Pricing strategy shift led to significantly lower average bill rates for new clients, dropping the overall average by over 20%. The change had not been forecasted, leading to the financial gap. Provided insights to the CFO and highlighted the need for proactive forecasting tied to future pricing strategy changes.

Key Achievements / Impact
Revealed the underlying cause of a major financial variance. Drove awareness that Pricing strategy shifts must be accompanied by forecasting models. Informed executive-level discussions and influenced cross-team accountability in future pricing changes.
Key Technologies / Tools Used
Microsoft SQL Server (MSSQL), SQL, Excel, Data Analysis, Root Cause Investigation
Role
Manager, Insurance and Profitability
ProService Hawaii
Sales Process Migration from ClientSpace to Salesforce
Mar
2018
Problem / Purpose
The company needed to transition its Sales process and Pricing workflows from ClientSpace to Salesforce to improve maintainability, reporting capabilities, and integration with broader systems.
Solution
Prioritized by leadership, led the collaboration with Salesforce consultants to design and test new Salesforce objects. Outlined required fields, data types, workflows, and ensured versioning was implemented for quoting history. Added pricing analytics fields to support future rate benchmarking. Personally tested the build before launch.
Key Achievements / Impact
Enabled a seamless transition of the Sales process into Salesforce with zero errors at launch. Built a robust setup still used by the Pricing Team today, supporting both operational use and long-term analytics.
Key Technologies / Tools Used
ClientSpace, Salesforce, Process Design, Pricing Analytics, QA Testing
Role
Manager, Insurance and Profitability
ProService Hawaii
Sales Funnel & Performance Reporting with Enhanced Metrics
Feb
2018
Problem / Purpose
The Sales Team lacked clear visibility into pipeline health and conversion performance. Salesforce reporting limitations restricted analytical depth and metric innovation.
Solution
Created a comprehensive reporting suite to track and analyze sales performance. Initially developed in Salesforce but transitioned to Tableau for flexibility. Delivered dashboards showing win rates, pipeline stage conversion, leakage, velocity, inflow/outflow, sales funnel progression, loss reasons, market segmentation performance, and sales cycle time. Developed documentation to introduce and contextualize new sales metrics.


Key Achievements / Impact
Enabled the Sales Team to make data-driven decisions based on newly introduced and more actionable metrics. Improved transparency across the sales funnel and supported better targeting, coaching, and strategic adjustments.
Key Technologies / Tools Used
Tableau, Salesforce, SQL, Sales Metrics Design, Sales Enablement, Dashboard Design
Role
Manager, Insurance and Profitability (self-initiated)
ProService Hawaii
Audit & Validation of Actuarial Workers’ Comp Reserve Models
Dec
2017
Dec 2020
Problem / Purpose
The company needed to ensure external actuarial reserve calculations were accurate and defensible.
Solution
Audited actuarial assumptions and validated three reserve models used by external actuaries. Discovered and corrected a $2M miscalculation in the 2018 reserve estimate, influencing financial reporting and planning.
Key Achievements / Impact
Identified a $2M actuarial error, protecting financial accuracy and strengthening internal oversight of actuarial work.
Key Technologies / Tools Used
Excel, Reserve Validation, Actuarial Analysis, Risk Management, Workers' Compensation
Role
Manager, Insurance and Profitability
ProService Hawaii
Sales Operations & Pricing Resource Hub
Dec
2017
Problem / Purpose
The Sales Operations Team frequently submitted incomplete or inaccurate health insurance quote requests, causing delays, compliance risks, and sales friction. Meanwhile, the Pricing Team lacked a centralized system for storing SOPs, reference files, and institutional knowledge, leading to inconsistent practices and onboarding challenges.
Solution
Took initiative to build an internal website that served both teams: for Sales Ops, it included step-by-step submission checklists, annotated examples of good and bad collateral, and visual guides to improve accuracy; for the Pricing Team, it centralized SOPs, reference materials, and documented rare edge-case scenarios to reduce tribal knowledge and ensure consistency.

Key Achievements / Impact
Submission accuracy improved from 50–60% to 83% in the first month, and stabilized at 95–99%. Enabled faster, more compliant sales cycles. Greatly reduced Pricing Team’s onboarding time and improved consistency by consolidating scattered procedures and institutional knowledge into a single source of truth.
Key Technologies / Tools Used
Google Sites, Visual Documentation, Process Improvement, Training Material Development, Operational Knowledge Management, Sales Operations Enablement
Role
Manager, Insurance and Profitability (self-initiated)
ProService Hawaii
Annual Client Healthcare Renewal Strategy
Jun
2017
Jan 2021
Problem / Purpose
Each year, client healthcare plans had to be renewed in compliance with state regulations and health carrier restrictions. The renewal process required balancing financial impact to clients, regulatory compliance, and maintaining the profitability of a $10M+ healthcare book.
Solution
Managed the end-to-end healthcare renewal process annually, starting in 2017. Pulled data from Microsoft SQL Server and SSRS, merged with carrier and actuarial files in Excel. Modeled financial impacts (total, employer, employee), tested alternative plans, and ensured compliance with renewal fairness regulations and HIPAA. Created a standardized Excel tool reused annually, including high-level summaries. Led internal strategy discussions with the CEO, negotiated with health carriers, and enabled Account Managers with tailored client collateral. Maintained plan structures across tiered, flat, and minimum premium models, with custom quotes handled as needed.
Key Achievements / Impact
Successfully managed $10M+ annual healthcare book with consistently profitable performance. Maintained regulatory compliance and HIPAA safeguards. Retained nearly all clients through renewals while balancing client financial impact and long-term risk exposure. Consistently had a 2% to 7% surplus.
Key Technologies / Tools Used
Excel (Advanced Formulas), Excel, Microsoft SQL Server (MSSQL), Healthcare Analytics, Financial Modeling, HIPAA Compliance, Regulatory Compliance, Risk Analysis
Role
Manager, Insurance and Profitability
ProService Hawaii
Executive & Board-Level Insurance Analytics
Jun
2017
Problem / Purpose
The Executive Team and Board needed recurring, insight-driven reporting across multiple insurance lines, but there was no standard, consolidated analytics package in place.
Solution
Built quarterly and annual insurance analytics for healthcare, workers’ comp (captive), unemployment insurance, and temporary disability (captive). Pulled data from SQL and SSRS reports, then combined and analyzed in Excel. Iterated directly with the CEO to refine KPIs and visualizations for board presentation.
Key Achievements / Impact
Delivered executive-ready analytics used for strategic decision-making and risk monitoring. Built credibility with C-suite and Board by transforming complex data into clear, actionable insights.
Key Technologies / Tools Used
SQL, SQL Server Reporting Services (SSRS), Excel, Insurance Analytics, Executive Reporting, Healthcare Analytics, Workers' Compensation Analytics
Role
Manager, Insurance and Profitability
ProService Hawaii
Company-Wide Mass Repricing Implementation
Jan
2017
Problem / Purpose
A company-wide pricing change required repricing all clients—typically a high-risk, manual process with potential for client confusion and internal errors.
Solution
Analyzed all client data using SQL and Excel to calculate updated rates. Built an Excel macro to auto-generate client-specific collateral sheets showing rate changes. Created a clean dataset for Client Operations and Payroll Configuration to use for contract updates and rate setup. Executed the rollout with zero errors.

Key Achievements / Impact
Successfully repriced all clients in a single coordinated process. Enabled clean client communication and streamlined implementation across teams. Execution was error-free.
Key Technologies / Tools Used
SQL, Excel, Excel Macros, Mass Rate Modeling, Process Automation, Cross-Team Coordination
Role
Pricing Analyst
ProService Hawaii
Health Coverage Rating Rules for New Business
Nov
2016
Problem / Purpose
Incoming client healthcare rates were based on actuarial input but lacked consistent, data-driven business rules tailored to segment-level risk. This limited the company’s ability to proactively manage portfolio risk while remaining competitive.
Solution
Analyzed claim trends across business segments to define and refine standardized rules for quoting health coverage rates. Filed the rules with the Hawaii Insurance Commissioner to ensure regulatory compliance. These rules were implemented by the Pricing Team and guided how actuarial ratings were adjusted for quoting new business.
Key Achievements / Impact
Established formal rating guidelines that reduced risk exposure while increasing pricing flexibility for desirable business segments. Enabled the company to better balance competitiveness with long-term portfolio stability. Rules remain in use by the Pricing Team.
Key Technologies / Tools Used
Claims Data Analysis, Risk Segmentation, Rate Rule Design, Regulatory Filing, Health Insurance, Health Insurance Underwriting, Insurance Underwriting, Risk Analysis, Insurance Pricing
Role
Pricing Analyst
ProService Hawaii
Unemployment Rate Forecasting & Risk Stratification
Jun
2016
Jan 2021
Problem / Purpose
Accurate forecasting of state unemployment insurance (SUI) rate schedule shifts and client-level renewals was critical for financial planning, risk management, and client pricing—but was historically reactive and imprecise.
Solution
Used public unemployment fund data, internal claims, and wage history to forecast the state’s upcoming SUI rate schedule and predict client-level renewal rates. Applied the forecast to refine risk stratification strategy. Created forecasts with 100% accuracy at the state level and near-perfect accuracy for client renewals (only a few missed due to rate threshold shifts).
Key Achievements / Impact
Accurately predicted state SUI schedule changes, enabling proactive strategy planning. Improved risk segmentation and client renewal forecasting accuracy. Strengthened credibility of Pricing and Risk teams.
Key Technologies / Tools Used
Excel, SQL, Public Data Integration, Forecasting Models, Risk Stratification, Claims Data Analysis
Role
Pricing Analyst
ProService Hawaii
Sales Workflow Redesign in ClientSpace
Sep
2015
Problem / Purpose
The Sales Operations Team was advancing through ClientSpace workflows without reviewing or completing key fields, resulting in missing information and repeated back-and-forth with Pricing. This created delays and friction for potential clients during the sales process.
Solution
Redesigned the ClientSpace workflow and field structure to require more deliberate review and completion of key steps before advancing. Although it slightly slowed the initial process, it significantly reduced the need for follow-up, improved data quality, and streamlined handoff to Pricing.
Key Achievements / Impact
Reduced rework and back-and-forth between Sales Ops and Pricing. Improved the client experience by minimizing delays caused by incomplete submissions and reducing friction during the sales cycle.
Key Technologies / Tools Used
ClientSpace, Process Improvement, Sales Operations Enablement, Process Design
Role
Pricing Analyst (self-initiated)
ProService Hawaii
Competitor Intelligence Repository & Sales Enablement
Feb
2015
Problem / Purpose
Information about competitor products, pricing, and strategies was sporadically gathered but not stored or leveraged in a systematic way. Sales and Pricing lacked a consistent view of competitive positioning.
Solution
Created a centralized competitor repository to track rates, product details, and pricing methods across known competitors. Used the data to generate collateral for the Sales Team to highlight our value proposition during pitches and to guide Pricing decisions when bidding against specific competitors.
Key Achievements / Impact
Improved pricing strategy and sales pitch alignment by providing structured, up-to-date competitor insights. Helped Sales better position offerings and supported more informed pricing in competitive scenarios.
Key Technologies / Tools Used
Excel, Competitive Analysis, Sales Enablement, Market Research, Pricing Strategy
Role
Pricing Analyst (self-initiated)
ProService Hawaii